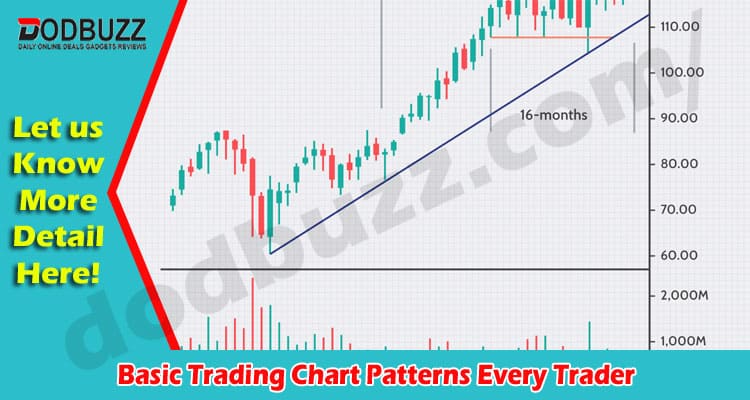
Basic Trading Chart Patterns Every Trader: Chart patterns are crucial for every technical analysis because you translate them into a price chart. This visual representation can give you a better insight into where prices might be going.
It’s a concept of looking at past performance to determine future outcomes. Knowing how to use and understand chart patterns is a must for every trader.
Before we get into different designs, it’s important to say that there’s no “top” chart out there. All of them present a variety of trends that can be good or bad depending on the investor’s business type, market, and goals.
How to recognize chart patterns more easily
Beginners often have a difficult time recognizing chart patterns on trading charts. Although every experienced trader will tell you that it comes naturally, you might find it pretty confusing at first.
Sometimes it’s all about getting a different presentation in front of you. To better understand the charts, try using a customizable tool to present those charts. Numerous solutions have the functionalities for recognizing and highlighting patterns to help you learn how to spot them.
Another suitable learning method is to add those patterns manually to trading charts. Be persistent and work on these skills as hard as you can, as they will help you be more competitive in the market and get better value out of your technical analyses and volume analysis trading.
Descending triangle
Let’s start off with some of the most straightforward patterns. The descending triangle is a pattern that indicates the continuous trend of value drops. Traders usually enter short positions when they notice a descending triangle pattern to try and profit from the falling market.
Ascending triangle
Ascending triangles are the opposite of descending triangles. The trend line shows a continuous uptrend pattern. It’s possible to draw ascending triangles into charts by using a horizontal line that
touches all swing highs and swing lows. In most cases, these patterns have several identical peak highs.
Wedge
Wedges create when price movements get together between two trend lines, and they can be ascending and descending. Wedges have converging trend lines, and their volume is declining while the price is progressing. This pattern is unique because it has a trend line breakout.
Rounding bottom
This chart pattern signals a reversal or continuation. For example, the asset price during an uptrend can fall a bit before rising again.
These patterns can change within a couple of months and down to several weeks. In an ideal scenario, the price and volume move together. Many traders look to earn from this pattern by buying low and capitalizing on future continuation.
Double bottom
This pattern is usually associated with a sale period when a particular asset’s price drops below support. The asset price then grows to a resistance level, only to fall again. During the third phase, the trend changes again and goes upward during the bullish market.
Pennant
The pennant pattern forms during large stock movements followed by a consolidation period. Converging lines create a pennant shape and lead to a breakout in the same direction where the big stock is moving. This trend typically lasts a week and up to three weeks in most cases.
Head and shoulders
The head and shoulders pattern occurs when a market trend reverses from a bullish or a bearish trend, indicating three successive declines and upticks. A top pattern signals a bearish downward reversal, while its bottom counterpart forms an upward bullish reversal.
Conclusion
These chart patterns can be handy technical analysis tools for understanding why an asset price behaves in a certain way. With this information, every investor and trader can make better future moves.
Take the time to understand them entirely before you start using them practically. That’s the only way to get the most out of your trading efforts and pave the way to a profitable career.


